
Floating Forests Comes to the Classroom!
Hello everyone! It’s been a while since our last update but we want to share some exciting new developments.
One thing that we frequently get asked is how Floating Forests can be used as a classroom activity. In the past, we haven’t had a particularly structured response; most classroom integration of Floating Forests has been case by case and informal. While there is certainly great value in self-motivated exploration, tools like Floating Forests really shine when they are presented alongside the background and context that allows participants to more deeply connect with what they are seeing.
In order to close this gap and learn about how we can better incorporate citizen science into the classroom, Zooniverse has collaborated with project scientists to create structured lab activities that give students a chance to learn about projects on a higher level. We are very excited to announce that Floating Forests was one of those projects, and our activity has been released! Check it out here on the Zooniverse classrooms page! While you’re there, feel free to look around some of the other projects as well: here is a top-level link.
This activity was initially developed for undergraduates in general education science courses, but it is appropriate for any undergraduate environmental science (or similar) course, and should be easily adaptable for high school or middle school. If you are a K12 educator and you have any interest in such an adaptation, PLEASE REACH OUT via email at this link – we would love an opportunity to expand this content!
The activity itself can be found here, and is suitable for most course formats, including virtual or asynchronous learning. It has three sections: 1) climate change background, 2) an introduction to Floating Forests, and 3) several case studies that present data generated by citizen scientists on Floating Forests in the context of climate change.
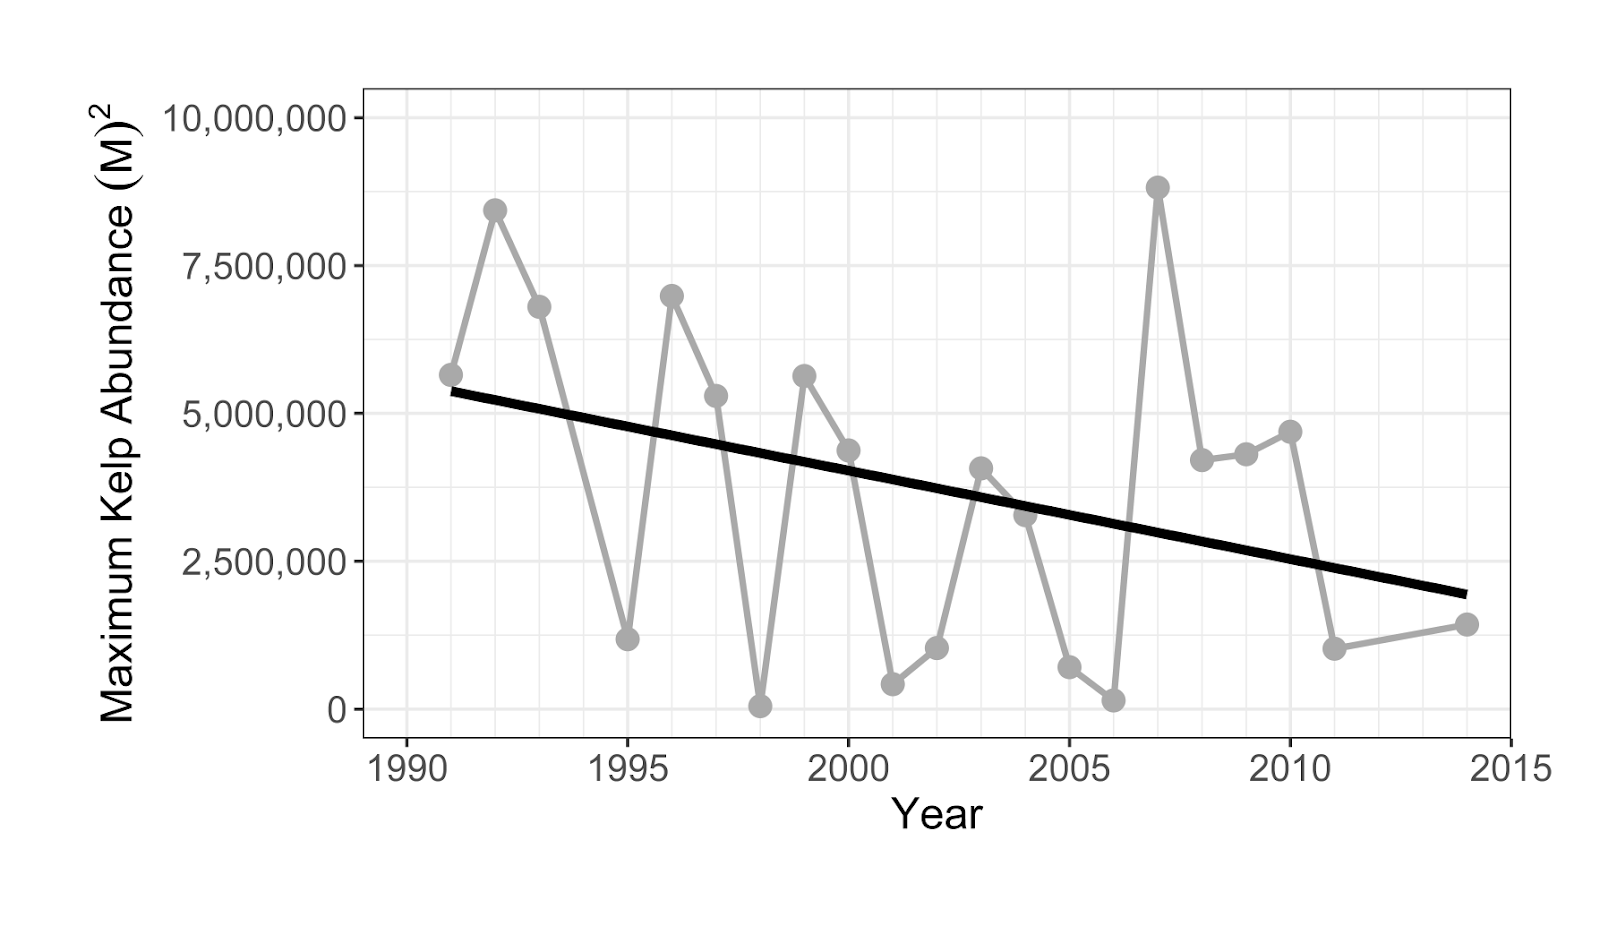
Example figure from our activity. This graph depicts kelp coverage in Tasmania, Australia as classified by Floating Forests participants. Students are also provided with additional data about kelp life history, as well as a temperature record of the local area and tasked with elucidating how kelp coverage and water temperature are related.
Although we hope folks pick up some concrete knowledge about climate change and kelp, the true goal of this activity is to foster scientific self-efficacy, data literacy, and self-confidence that will allow participants to be more self-sufficient with regard to scientific topics in our modern lives. We do this by presenting information in several ways including text, graphs, maps, and hypothetical debates. We also emphasize topics that are transferable out of environmental science, such as thinking at multiple scales and recognizing (and articulating) patterns in graphs.
This activity is free to use and has been pilot tested by over 1000 students at 6 universities: based on our evaluations, we are confident that it is a positive experience for our participants. We’ve received a lot of great feedback so far but that said, we are always happy to hear from anyone who gives it a try! Don’t hesitate to reach out with any questions, comments, suggestions, or concerns!
A Tale of Plankton and Sewage
Welcome back for another update! Our urban kelp survey is now 100% live. Thanks to you all we BLEW through our first round of images (seriously, over 8000 images in exactly one month!!!) , and we are now ready to start classifying kelp!
Today we’ll briefly talk about our choice for our California site, Los Angeles.

Image Source: Google Earth, accessed 6/12/2020
LA is currently the largest in our study, at least in terms of population/density. It saw its biggest population boom in the early to mid 1900s as both the entertainment and war industries grew. Unfortunately for us, we don’t have satellite data from this time. While we are missing the major population growth spike, Los Angeles continues to be a major metropolitan hub – it is the 2nd most populated city in the United States, and one of the largest worldwide!
The kelp forests in California have a patchy (ha ha…) history that is often closely linked to human activities – If you ask a phycologist about it, you’ll almost certainly hear about the Point Loma and Palos Verdes kelp forests. These two coastal kelp beds are located near San Diego and Los Angeles, respectively, and are infamous for sustaining massive kelp loss in the first half of the 1900s. This was due to a variety of factors, some natural and some human, but it seems that urban sewage discharge was the straw that broke the kelp forests back.
In the case of Point Loma, a broken sewage pipe discharged almost 200 million gallons of sewage into the kelp forest, leading to quick and major kelp loss. Luckily the area quickly recovered after the pipe was repaired – one advantage of kelp’s fast and furious life style is that it can quickly repopulate a large area if environmental conditions are restored! Palos Verdes has had a longer road to recovery, although recent restoration efforts have been successful in recovering many acres of kelp forest.
Discharge from sewer systems is bad for kelp in several ways. The discharge tends to be full of sediments (solid material suspended in the water). This can prevent growing kelp from getting sufficient light or can even completely bury small individuals. Another negative impact associated with these outfalls is nutrient pollution. In some cases, chemicals like ammonia can spike to toxic levels, causing immediate damage.
In other cases, elevated nutrient levels can simply “fertilize” the water. Your first reaction might be to think that this would be good for the kelp, and maybe in a vacuum it would be, but nature isn’t that simple. In this case, the complication comes from phytoplankton, which can compete with kelp for light by forming floating algal mats that block light and shade the seafloor.
Kelp grows quickly, but not as quickly as phytoplankton. When water nutrient levels are elevated (a condition called eutrophication), plankton growth can ramp up into what is called a plankton bloom. That’s a lot of words to say that these algal blooms can have major effects on the ecosystem. This picture might “clear” things up (ecological puns never get old…). These thick green algal blooms are more characteristic of fresh water, but I think this does a good job of illustrating how severe these can be.

Image source: Tim Otten, Oregon State University
The immediate, kelp-relevant effect is a reduction in light at the sea floor. The longer term effects can include reduced oxygen levels in the water, creating uninhabitable “dead zones. This low-oxygen condition is called hypoxia and is a result of rotting phytoplankton. The typical life cycle of a bloom goes something like this:
- Eutrophication event (discharge or runoff causes elevated nutrient levels in the water)
- Algal bloom (opportunistic plankton grow exponentially given high nutrient levels)
- Overgrowth (algal population exceeds available nutrients; growth eventually stops as nutrients are depleted) – Light levels beneath the water’s surface reduced
- Decomposition (algal bloom dies and decomposes. Bacteria associated with decomposition consume oxygen, creating a dead zone) – Hypoxic conditions form, many animals die or leave
Kelps are potentially affected by almost every step of this process. They are shaded out by the initial bloom and then potentially buried in detritus as the plankton decomposes. Many of the animals found in kelp forests are vulnerable to the dead zones caused by algal blooms. Loss of these kelp forest residents can further destabilize the ecosystem.
While the stories of Point Loma and Palos Verdes unfortunately played out mostly outside of Floating Forest’s time window, they serve as clear reminders that human activities can seriously affect kelp forests. Things like sewage discharge and eutrophication are global issues; California may be a high profile example, but is far from the only one. As we continue to explore the effects of urbanization, we will be sure to include as many local factors (such as sewage treatment outfall points) as possible to best understand each of our sites.
Kelp and the Big City
If you’ve read through our “about section” or seen our blog in the past, you’ll know that kelp is threatened by climate change. This is perhaps the main reason why we are so interested in kelp in the first place, and so far Floating Forests has allowed us to build some of the most complete kelp forest datasets around. Soon we will be adding a new set of images to the project, this time examining a few key, high-risk locations with a fine-toothed comb. We’re interested in how coastal construction or development might impact kelp forests – it’s time to take our kelp research to the city! We will be taking a close look at kelp forests in California, Chile, Argentina, Australia, and New Zealand.
While global climate change is extremely important, there is great value in examining smaller scales as well. In fact, studies such as this one have shown that kelp forests are strongly affected by local conditions! As you might expect, changes to these local environmental conditions can have significant effects on the local wildlife.
We call changes that affect the environment “drivers”. For example, a construction project could “drive” environmental change by releasing sand and dirt (which are collectively referred to as “sediments”) into the water. When two different drivers interact and affect each other, we refer to them as “synergistic”. Occasionally they can create especially favorable conditions, but often one exacerbates the negative effects of the other, so we call these “synergistic stressors”.
One way to think about this is to say that one driver can amplify the effects of another. For example: a marine ecosystem might be able to handle a 2° Celsius increase in average temperature without collapsing. Separately, it also might be able to handle the effects of a large construction project. However, the effects of both at the same time could prove catastrophic: organisms already stressed by warming might not be able to cope with disturbances caused by the construction, and most importantly, things might get bad much more quickly than we might expect.
Because an emoji is worth a thousand words:

This example is one of the many that play out across an ever-developing world. One consistent trend over the last several decades has been a large increase in coastal population. To say this more plainly – more people than ever before live near the coast. As coastal cities grow, constant expansion is needed in order to keep up with the population. This conversion of land from natural to urban terrain is known as “urbanization” and brings with it a host of environmental impacts – some of which are potentially harmful for kelp forests.
By digging into the satellite record, we can get an idea of how kelp forests in urban areas have changed over the last few decades in response to this trend of development. What’s really exciting about this opportunity is that with the power of citizen science we can cover a lot of ground: we want to compare cities across the globe in order to build a better understanding of how kelp in different places is affected by human activities. We expect there to be many interesting differences between these locations – it would probably be more surprising to learn that kelp in Australia was acting exactly like kelp in Chile!
Stay tuned as we prep for the launch of this exciting phase of Floating Forests – details about our study sites and more about the connections between urbanization and kelp coming soon!
Kelp, Seasons, and the Falkland Islands
I’ve been playing around with some of the incoming classifications and thought I’d share this little map as a preview of what is possible with the data created by all of you! Click the map to launch an interactive map of the Falkland Islands! Use the menu in the top right to toggle each season on/off, and try zooming in to see individual patches!

The green patches represent the aggregates of everyone’s classifications – what you are looking at here is all of our data from the Falkland Islands. All years are lumped together for now as there are still some gaps in the time series (we’re almost there, just 16% to go!). In other words, these patches represent maximum patch size for each season. Another technical note: these polygons are based off a 6 user consensus, our current candidate for best accuracy.
Giant kelp growth patterns are often dominated by seasonal processes such as storms. This can lead to an annual ebb and flow in which kelp patches grow rapidly throughout the spring and summer before dying back (or getting wiped out) in the winter.
We can see this pattern in our data too! Note how the annual minimum kelp extent occurs in the austral winter (June, July, and August), with growth beginning in the austral spring (September, October, November) and increasing throughout the summer.
One great thing about Floating Forests is that I am constantly amazed with how much we can learn even with a quick look at the data. Check out the waypoint marked “Tyssen Patch”. This is actually an undersea shoal (note the color difference on the basemap), and notice how much kelp is there! Here is the google maps link if you want to prove it to yourself – definitely #sokelpy!
Once we get the time series data online I am very interested to see how persistent this patch has been over the years. Stay tuned!
Welcome to Floating Forests 2.0!
If you are reading this post, it means the Floating Forests relaunch is live – thanks to all of your hard work we were able to get through over 20 years worth of data! Special thanks to the beta testers who gave us tons of feedback on the new site. We are busy on our end calibrating the results from the first round of data and it’s looking great. I don’t want to spill the beans on a future blog post, but working with this dataset has already led us down a new path with some unexpected collaborators!
As exciting as calibration models are, today’s main event is even better! Welcome to Floating Forests 2.0! We have been hard at work with Zooniverse to make your experience even better. In addition to a shiny new website, we’ll be taking you to a new part of the world – The Falkland Islands!
The Falkland Islands are an often overlooked ecological treasure. From land they appear a windswept grassland dominated by birds and insects, one of only a handful of places on Earth with no native trees. The coastal waters, however, are a different story altogether. You’ve probably guessed where this is going – kelp! Lots of kelp! The expansive kelp forests ringing the islands more than make up for the lack of terrestrial trees. Kelp forests around the world are a haven for wildlife, and these are no different. They are an irreplaceable resource for elephant seals, fur seals, sealions, multiple penguin species, two types of dolphins, and a huge number of fish and invertebrates. A recent report1 has listed lack of awareness and information as one of the biggest threat to the Falkland Islands’ marine biodiversity, so lets generate data and get aware!
Before you dive in, lets take a quick tour of the new website – if you’re familiar with our old site you’ll already know the drill, but some things have been moved around!
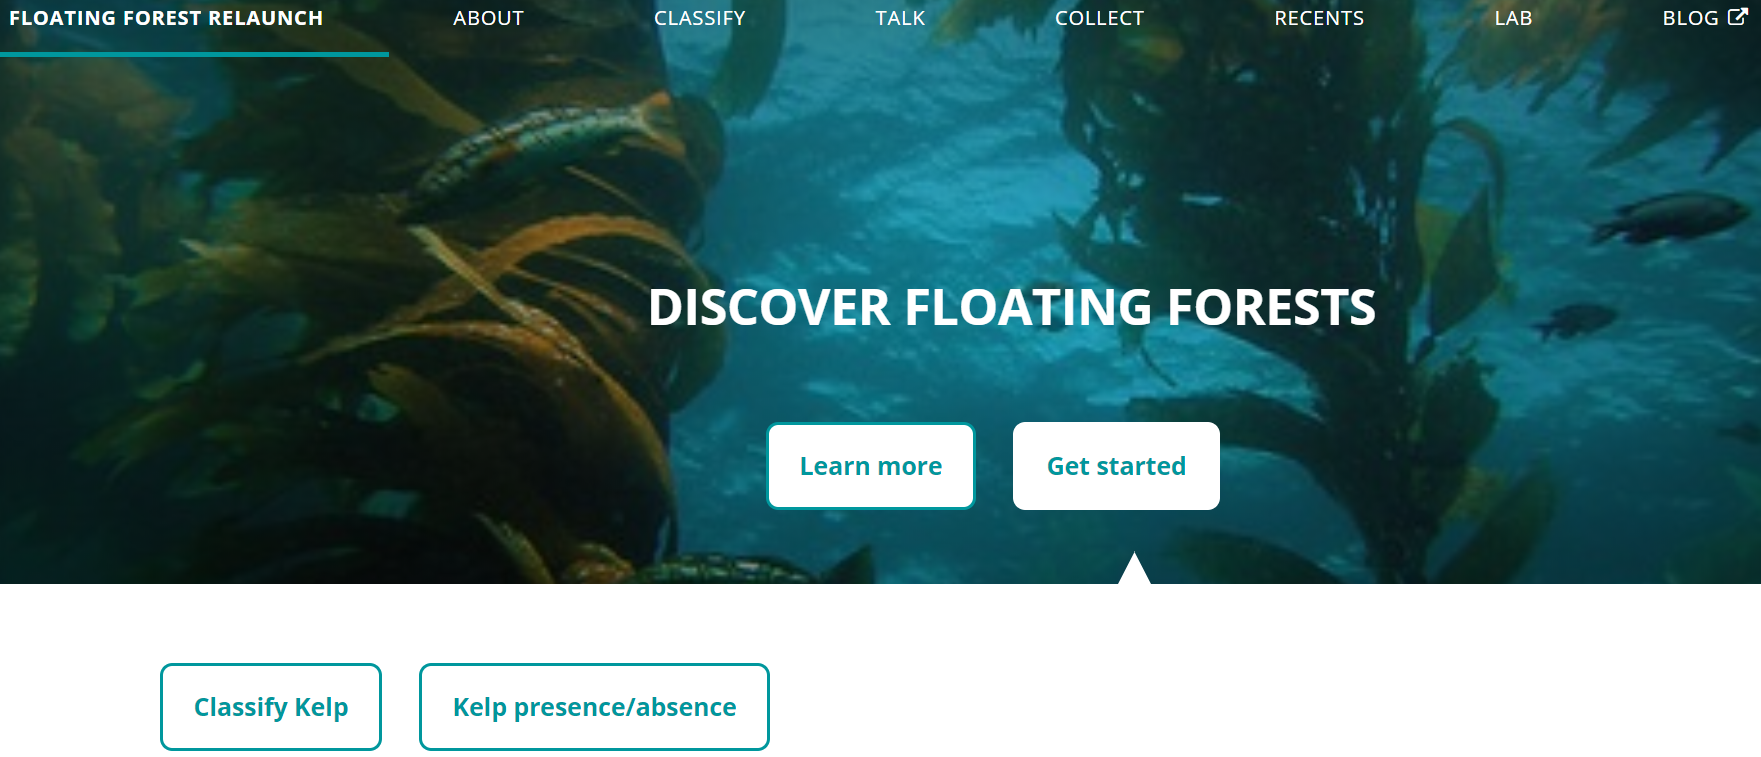
As you can see, there are two buttons at the bottom. “Classify Kelp” brings you to our shiny new version of the kelp tracing you all know and love. “Kelp presence/absence” you to a new feature- a simplified, mobile friendly task that can be done quickly and easily! This allows anyone who wants to check out the project to do so even if they don’t have access to a full computer. On the research side of things it allows us to squeeze every last drop of data out of these satellite images. To make a long story short, images from different satellites are different, and these differences make it somewhat difficult to automate a filter that boots out bad images. Just like with kelp classifications, our brains are much more useful here than computers. Once enough people have tagged an image as “kelp”, into the main workflow it goes to be classified!
Across the top, you will see a number of headings.
About: Learn about kelp, the project, and the team behind the research!
Classify: Get right to the action and start classifying kelp.
Talk: This links to our talk forum where you can discuss particular images, ask science questions, get technical help, and more! We will be very active here, so don’t hesitate to post!
Collect: More on this later, but this is where collections of images are found.
Recents: Link to your most recent classifications.
Blog: Direct link to the blog you are currently reading.

The classification should feel pretty familiar. The field guide tab on the far right has been overhauled and contains many examples of phenomena you could find in these images – refer to it often! It is constantly being updated, and if you have a suggestions for additions, let us know in talk!
Beneath the image are three buttons.

From the left:
Metadata: Click this to view metadata (location, time/date, satellite number), as well as a link to the image on google maps.
Favorite: Click this to add the image to your favorites, allowing you to quickly find it again.
Collect: Similar to adding an image to your favorites, you can add an image to a collection. This way we can collaboratively sort through images, keeping track of those that contain loads of kelp, cities, or any other identifiable feature.
Once you complete an image and have clicked the green “Done” button, you will see the following information:
Here you will see a summary of the number of patches you marked, as well as the blue “Talk” button. If you had any questions about the image, this button will create a discussion thread linked back to the image. Use this space to ask the science team any questions you might have about the image. Don’t be shy, we love to talk!
In addition to these front-end changes, there have been some under-the-hood updates as well that make it much easier for us to add images or collections and even create new workflows – stay tuned for future happenings with these features, but for now go check out the new site!
- Otley H. Falkland Islands Species Action Plan for Cetaceans 2008-2018.; 2008.
Floating Forests 2.0 – A Sneak Peak!
Hello! You may have noticed that things have slowed down on the website. To make a long story short, thanks to all of your help we are down to the last handful of images from California and Tasmania! We have been busy cleaning the data up and getting it ready to go. This milestone has given us a chance to reflect on the first phase of the project and to get ready for some exciting next steps – more on this later!
In January, science team members Jarrett Byrnes, Kyle Cavanaugh, and Isaac Rosenthal traveled to Chicago to meet with the Zooniverse team. We were hosted at the amazing Adler Planetarium, and had an unbelievable week of planning and collaboration (and eating!). By getting the science and development teams into the same room, we were able to work through a few issues that have been nagging the project since its inception, fixing some geo-referencing issues and streamlining the post-processing of the data (in other words, what happens to the data after the kelp is classified). It was truly amazing to spend a week surrounded by talent from so many disciplines, ranging from educators to back-end web developers. I think I speak for all of us when I say that it was a unique and deeply inspiring experience!
By far the most exciting part of the trip was our first look at the future of Floating Forests. We are extremely proud to show off our new and improved website – welcome to Floating Forests 2.0!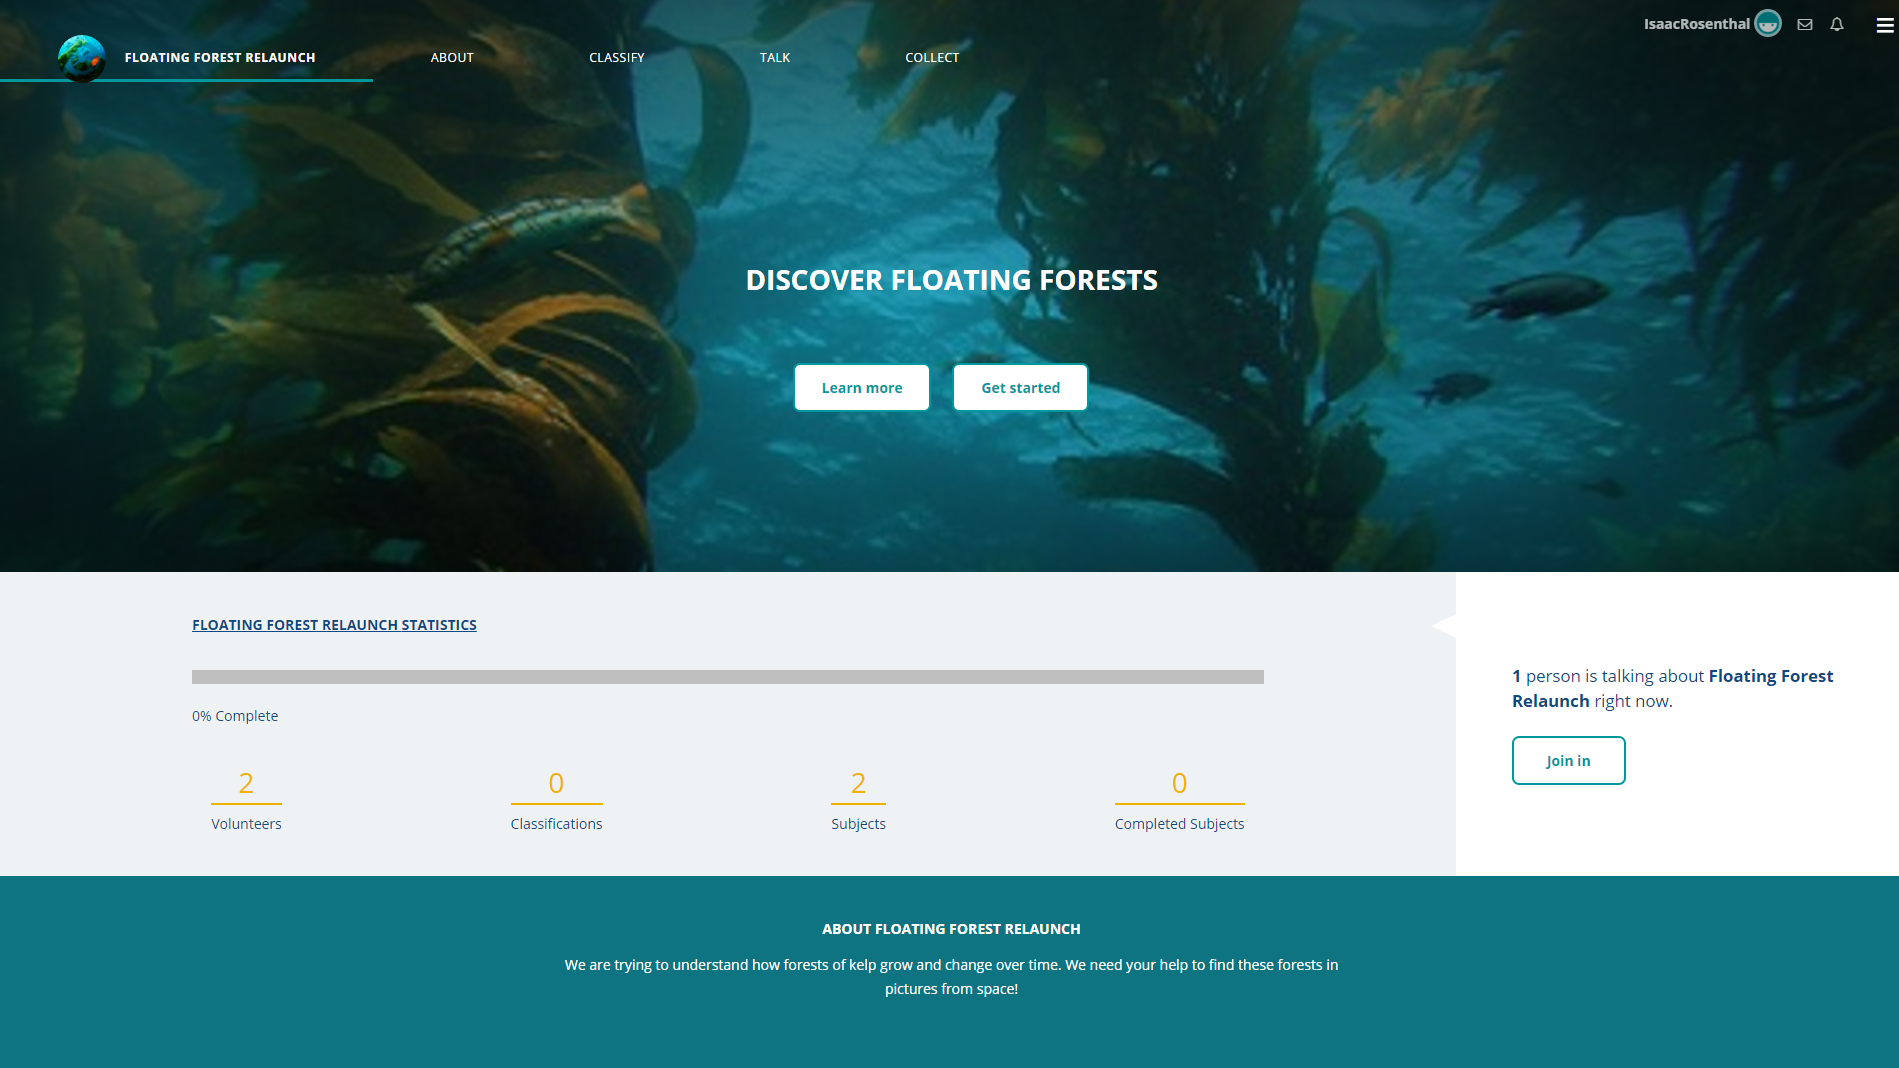
While still under construction, hopefully most of this is a familiar sight. Our goal with this relaunch is to make YOUR jobs easier! The tracing tool has been upgraded, and we will be able to spruce up the field guide. The under-the-hood flexibility of the new system is incredible and leaves the future of Floating Forests wide open. Custom datasets and modular workflows mean that the sky is the limit! Something that I am personally excited about is the opportunity to use these tools to ask new questions, broadening horizons for research and education. This relaunch will also feature an overhauled talk section so that we can continue to communicate with all of you!
Stay tuned for more information as we begin beta testing of the new website!

Recent Comments