
Zoom is coming!

Hey, all! You have asked us multiple times for a zoom interface. We have some reasons not to use a zoom tool – tradeoffs with speed, variability in accuracy between classifiers, etc. – but are intrigued and want to put our intuition to the test. If it’s better, we’ll switch to it full time, most likely! If the tradeoff isn’t worth it, we’ll know, and we’ll probably have an interesting paper come out of it.
But – we want to hear from you! In addition to the zoom interface itself (basically, the classify interface + a pan and zoom tool), are there questions you think we should be asking you after you complete a zoom classification that could yield new and interesting insights? Let us know over here!
Kelp, Seasons, and the Falkland Islands
I’ve been playing around with some of the incoming classifications and thought I’d share this little map as a preview of what is possible with the data created by all of you! Click the map to launch an interactive map of the Falkland Islands! Use the menu in the top right to toggle each season on/off, and try zooming in to see individual patches!

The green patches represent the aggregates of everyone’s classifications – what you are looking at here is all of our data from the Falkland Islands. All years are lumped together for now as there are still some gaps in the time series (we’re almost there, just 16% to go!). In other words, these patches represent maximum patch size for each season. Another technical note: these polygons are based off a 6 user consensus, our current candidate for best accuracy.
Giant kelp growth patterns are often dominated by seasonal processes such as storms. This can lead to an annual ebb and flow in which kelp patches grow rapidly throughout the spring and summer before dying back (or getting wiped out) in the winter.
We can see this pattern in our data too! Note how the annual minimum kelp extent occurs in the austral winter (June, July, and August), with growth beginning in the austral spring (September, October, November) and increasing throughout the summer.
One great thing about Floating Forests is that I am constantly amazed with how much we can learn even with a quick look at the data. Check out the waypoint marked “Tyssen Patch”. This is actually an undersea shoal (note the color difference on the basemap), and notice how much kelp is there! Here is the google maps link if you want to prove it to yourself – definitely #sokelpy!
Once we get the time series data online I am very interested to see how persistent this patch has been over the years. Stay tuned!
Data from Floating Forests for YOU!
The day has come – we’re finalizing our data pipeline to return data to you, our citizen scientists! It’s been a twisty road, and we’re still tweaking, but we’ve begun to build some usable products for your delecation and exploration!
We want to know more from **you** about what you want and what is interesting for you to explore, so, today, I’m going to post some demo data for you to look at and give us feedback and comments on. This is a data file from our California project that consists of polygons for each kelp forest at different levels of user agreement on whether pixels are kelp or not. So, first, here’s the file in three formats (depending on what you want) (we can also add more if asked for)
SQLite Lat/Long Projection
RDS (native R format) Lat/Long Projection
RDS (native R format) UTM Projection (Zone 10)
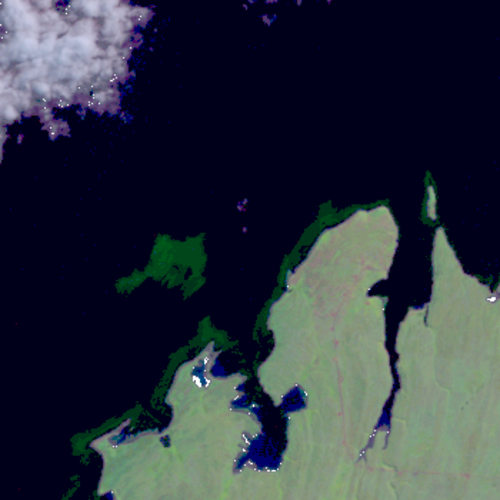
You can do a lot with these in whatever GIS software is your preference, and if anyone has examples, we’d love to post them! For now, here’s a quick and dirty visualization of the whole shebang at the 6 users agreeing on a pixel per threshold (source.

Neat, huh? You can even see where something in one image was confusing (no kelp on land!) which now I’m *very* curious about.
So, what’s in this dataset? There’s a lot, but here are things most relevant to you
threshold – the number of users who agree on the pixels in a given polygon are kelp
zooniverse_id – the subject (i.e., tile) id of a given image, if you want to just look at a single image, subset to that id
scene – Individual Landsat “images” are called scenes. So, every subject that we served to users was carved out of a scene. You can look at a whole scene by subsetting on this column. For more about what a scene name means, see here
classification_count – number of users who looked at a given subject
image_url – to pull up the subject as seen on Floating Forests
scene_timestamp – when was an image taken by the satellite?
activated_at – when did we post this to Floating Forests?
There’s a lot of other info regarding subject corner geospatial locations. We might or might not trim this out in future versions, although for now it helps us locate missing data and see what has actually been sampled.
So, take a gander, enjoy, and if you have any comments, fire them off to us! This is just a sample, and there’s more to come!
Have a Very Kelpy Holiday!
Thanks to all of our great citizen scientists! I loved this Tweet from Trine Bekkby and the Norwegian Blue Forests Network so much that I thought I’d post it. Look at that Laminara hyperborea! SO GORGEOUS!
From our kelp to your kelp, happy holidays!
Seasonality in the Falklands
As I’ve been browsing through these beautiful images of classifications in the Falklands, I realized something. One of the reasons to explore the Falklands is that there aren’t too many studies looking at more long-term kelp dynamics there. Now, I’m a Northern Hemisphere kelp forest ecologist. We know that typically many types of kelp forests start to boom in the spring, get to peak biomass in the late summer/early fall, and then get whacked back by fall/winter storms before booming again in the spring.
A #sokelpy image in #march
One of the first questions I have as a scientist, then, is do we see the same seasonal trends in the Falklands? I’m very curious what y’all are seeing, so, I started a thread on talk asking y’all to note any observations. Please also tag very kelpy images with the month they were taken (click the (i) for information) as well as the #sokelpy hashtag, so I can do a quick search by hashtag to see frequency of when #sokelpy occured. I’ll post the resulting data after we get a decent set of tagged images.
And talk about what you’re seeing – month by month, or if you’re noticing certain years have more or less kelp over in the thread!
(And, heck, we haven’t even talked about north v. south side of the islands – but that’s for another time!)
Welcome to Floating Forests 2.0!
If you are reading this post, it means the Floating Forests relaunch is live – thanks to all of your hard work we were able to get through over 20 years worth of data! Special thanks to the beta testers who gave us tons of feedback on the new site. We are busy on our end calibrating the results from the first round of data and it’s looking great. I don’t want to spill the beans on a future blog post, but working with this dataset has already led us down a new path with some unexpected collaborators!
As exciting as calibration models are, today’s main event is even better! Welcome to Floating Forests 2.0! We have been hard at work with Zooniverse to make your experience even better. In addition to a shiny new website, we’ll be taking you to a new part of the world – The Falkland Islands!
The Falkland Islands are an often overlooked ecological treasure. From land they appear a windswept grassland dominated by birds and insects, one of only a handful of places on Earth with no native trees. The coastal waters, however, are a different story altogether. You’ve probably guessed where this is going – kelp! Lots of kelp! The expansive kelp forests ringing the islands more than make up for the lack of terrestrial trees. Kelp forests around the world are a haven for wildlife, and these are no different. They are an irreplaceable resource for elephant seals, fur seals, sealions, multiple penguin species, two types of dolphins, and a huge number of fish and invertebrates. A recent report1 has listed lack of awareness and information as one of the biggest threat to the Falkland Islands’ marine biodiversity, so lets generate data and get aware!
Before you dive in, lets take a quick tour of the new website – if you’re familiar with our old site you’ll already know the drill, but some things have been moved around!
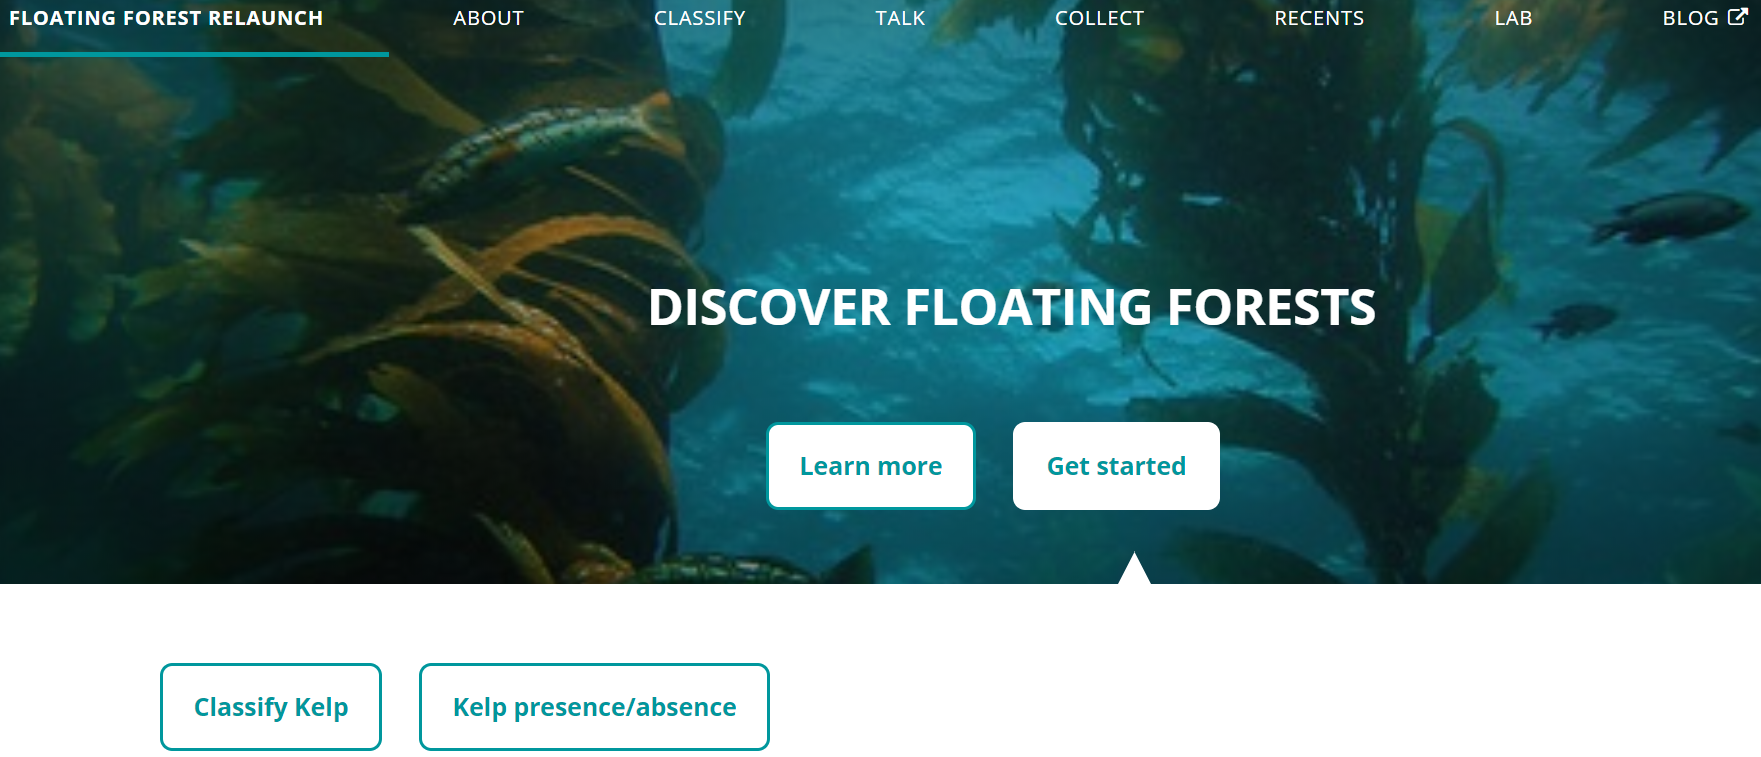
As you can see, there are two buttons at the bottom. “Classify Kelp” brings you to our shiny new version of the kelp tracing you all know and love. “Kelp presence/absence” you to a new feature- a simplified, mobile friendly task that can be done quickly and easily! This allows anyone who wants to check out the project to do so even if they don’t have access to a full computer. On the research side of things it allows us to squeeze every last drop of data out of these satellite images. To make a long story short, images from different satellites are different, and these differences make it somewhat difficult to automate a filter that boots out bad images. Just like with kelp classifications, our brains are much more useful here than computers. Once enough people have tagged an image as “kelp”, into the main workflow it goes to be classified!
Across the top, you will see a number of headings.
About: Learn about kelp, the project, and the team behind the research!
Classify: Get right to the action and start classifying kelp.
Talk: This links to our talk forum where you can discuss particular images, ask science questions, get technical help, and more! We will be very active here, so don’t hesitate to post!
Collect: More on this later, but this is where collections of images are found.
Recents: Link to your most recent classifications.
Blog: Direct link to the blog you are currently reading.

The classification should feel pretty familiar. The field guide tab on the far right has been overhauled and contains many examples of phenomena you could find in these images – refer to it often! It is constantly being updated, and if you have a suggestions for additions, let us know in talk!
Beneath the image are three buttons.

From the left:
Metadata: Click this to view metadata (location, time/date, satellite number), as well as a link to the image on google maps.
Favorite: Click this to add the image to your favorites, allowing you to quickly find it again.
Collect: Similar to adding an image to your favorites, you can add an image to a collection. This way we can collaboratively sort through images, keeping track of those that contain loads of kelp, cities, or any other identifiable feature.
Once you complete an image and have clicked the green “Done” button, you will see the following information:
Here you will see a summary of the number of patches you marked, as well as the blue “Talk” button. If you had any questions about the image, this button will create a discussion thread linked back to the image. Use this space to ask the science team any questions you might have about the image. Don’t be shy, we love to talk!
In addition to these front-end changes, there have been some under-the-hood updates as well that make it much easier for us to add images or collections and even create new workflows – stay tuned for future happenings with these features, but for now go check out the new site!
- Otley H. Falkland Islands Species Action Plan for Cetaceans 2008-2018.; 2008.
Floating Forests 2.0 – A Sneak Peak!
Hello! You may have noticed that things have slowed down on the website. To make a long story short, thanks to all of your help we are down to the last handful of images from California and Tasmania! We have been busy cleaning the data up and getting it ready to go. This milestone has given us a chance to reflect on the first phase of the project and to get ready for some exciting next steps – more on this later!
In January, science team members Jarrett Byrnes, Kyle Cavanaugh, and Isaac Rosenthal traveled to Chicago to meet with the Zooniverse team. We were hosted at the amazing Adler Planetarium, and had an unbelievable week of planning and collaboration (and eating!). By getting the science and development teams into the same room, we were able to work through a few issues that have been nagging the project since its inception, fixing some geo-referencing issues and streamlining the post-processing of the data (in other words, what happens to the data after the kelp is classified). It was truly amazing to spend a week surrounded by talent from so many disciplines, ranging from educators to back-end web developers. I think I speak for all of us when I say that it was a unique and deeply inspiring experience!
By far the most exciting part of the trip was our first look at the future of Floating Forests. We are extremely proud to show off our new and improved website – welcome to Floating Forests 2.0!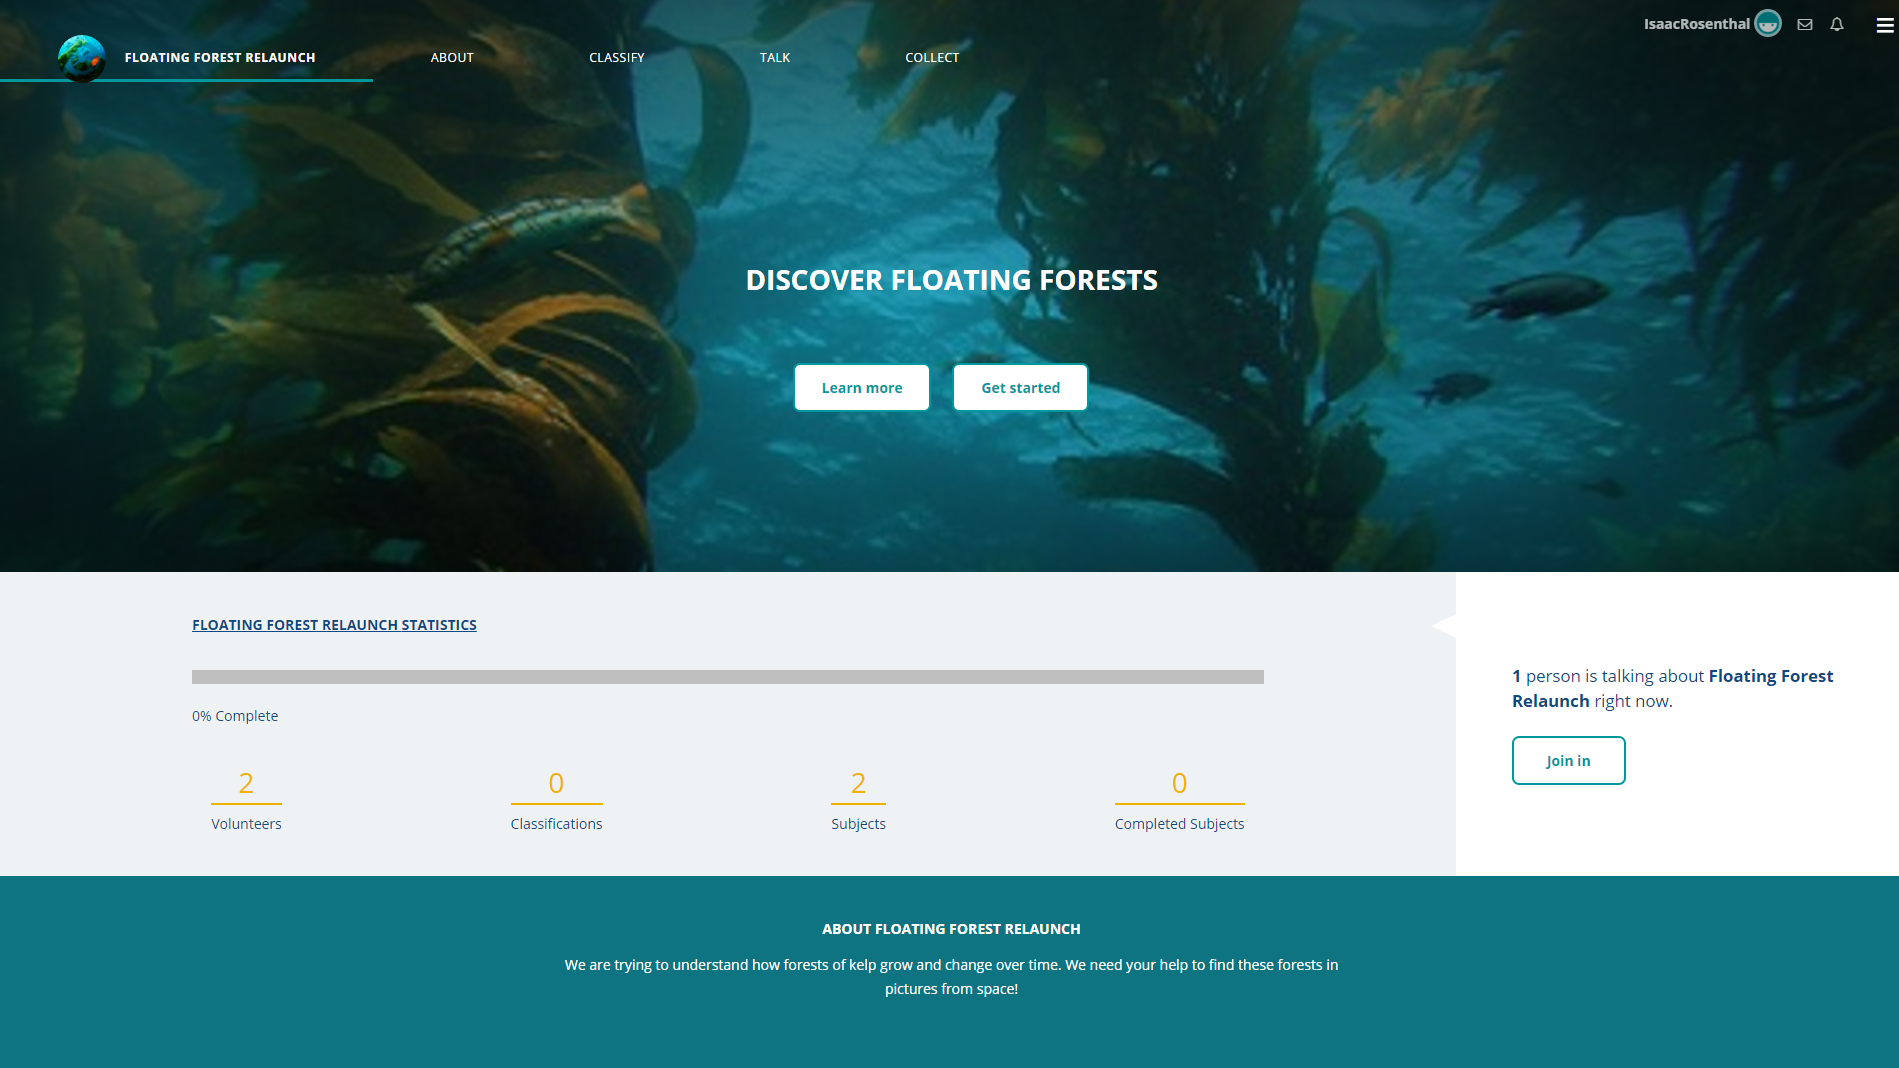
While still under construction, hopefully most of this is a familiar sight. Our goal with this relaunch is to make YOUR jobs easier! The tracing tool has been upgraded, and we will be able to spruce up the field guide. The under-the-hood flexibility of the new system is incredible and leaves the future of Floating Forests wide open. Custom datasets and modular workflows mean that the sky is the limit! Something that I am personally excited about is the opportunity to use these tools to ask new questions, broadening horizons for research and education. This relaunch will also feature an overhauled talk section so that we can continue to communicate with all of you!
Stay tuned for more information as we begin beta testing of the new website!
Floating Forests Goes to Washington
![]() Last week I had the opportunity to take part in a citizen science forum organized by the White House. It was inspiring to see how committed the White House is to harnessing the power of citizen science. A number of exciting announcements were made during the event. For one, the Federal Citizen Science and Crowdsourcing Toolkit was officially released. This toolkit, developed with the support and collaboration of over 25 federal agencies, provides step-by-step instructions, case studies, and other resources to help scientists use citizen science in their research. As you might imagine, Zooniverse projects are well represented in the successful case studies section! Then John Holdren, the Director of the Office of Science and Technology Policy, gave a talk where he announced the release of a memorandum promoting the use of citizen science by Federal Agencies. Towards the end of the forum Senator Chris Coons (D-DE) announced a new bill authorizing citizen science and crowdsourcing. This bill is co-sponsored by Senator Steve Daines (R-MT), making it bi-partisan! During his talk Senator Coons described how he and his family were citizen scientists themselves and have spent many evenings collecting data for a wide variety of different Zooniverse projects! So next time you are chatting with someone on Talk, know that he or she could very well be a senator or representative. Perhaps even President Obama has a Zooniverse account?
Last week I had the opportunity to take part in a citizen science forum organized by the White House. It was inspiring to see how committed the White House is to harnessing the power of citizen science. A number of exciting announcements were made during the event. For one, the Federal Citizen Science and Crowdsourcing Toolkit was officially released. This toolkit, developed with the support and collaboration of over 25 federal agencies, provides step-by-step instructions, case studies, and other resources to help scientists use citizen science in their research. As you might imagine, Zooniverse projects are well represented in the successful case studies section! Then John Holdren, the Director of the Office of Science and Technology Policy, gave a talk where he announced the release of a memorandum promoting the use of citizen science by Federal Agencies. Towards the end of the forum Senator Chris Coons (D-DE) announced a new bill authorizing citizen science and crowdsourcing. This bill is co-sponsored by Senator Steve Daines (R-MT), making it bi-partisan! During his talk Senator Coons described how he and his family were citizen scientists themselves and have spent many evenings collecting data for a wide variety of different Zooniverse projects! So next time you are chatting with someone on Talk, know that he or she could very well be a senator or representative. Perhaps even President Obama has a Zooniverse account?
In between these exciting announcements there were panels on Community Science Leaders, Oceans and Coasts, Democratized Tools, Water and Agriculture, and Communities and Health. A number of really exciting citizen science projects were highlighted during these panels. These ranged from investigations of the impact of aggressive policing to surfboards that collect oceanographic data to the development of methods for utilizing indigenous traditional knowledge to our own Floating Forests! You can watch the entire forum here.
I had the honor to serve on the Oceans and Coasts panel with some HUGE names in the marine science world: Dr. Alex Dehgan, Dr. Sylvia Earle (aka Her Deepness), Dr. Daniel Pauly, and Dr. Janet Coffey. During the panel we talked about the importance of the ocean and how little we know about it. The oceans play a central role is supporting human life. Yet we’ve mapped less of the ocean floor at high resolution than the surface of Mars, Venus, and the Moon combined. We have limited information about the changes that coastal ecosystems like coral reefs, mangroves, and giant kelp have been experiencing in recent decades. Citizen science provides a powerful method for collecting data that will allow us to better understand and protect these critical ecosystems.
Floating Forests at the White House!
We were delighted to have our own Kyle Cavanaugh presenting Floating Forests at the White House Citizen Science Forum earlier this week. Check out the video of his presentation below!

Recent Comments