
Who’s Getting Kelpy at Floating Forests?
Well, we’ve finally hit a critical mass of classifications (well, blown past it) and other projects by science team members have boiled down (we’ll be posting about them – they’re kelpy!), so we’ve begun to dig into the data. For anyone who wants to follow along at him, all code that we talk about will be posted in this github repository.
I thought I’d begin by telling you all about how *you* have been interacting with Floating Forests. Namely, how much effort do the ~5,100 users of FF put into FF the project
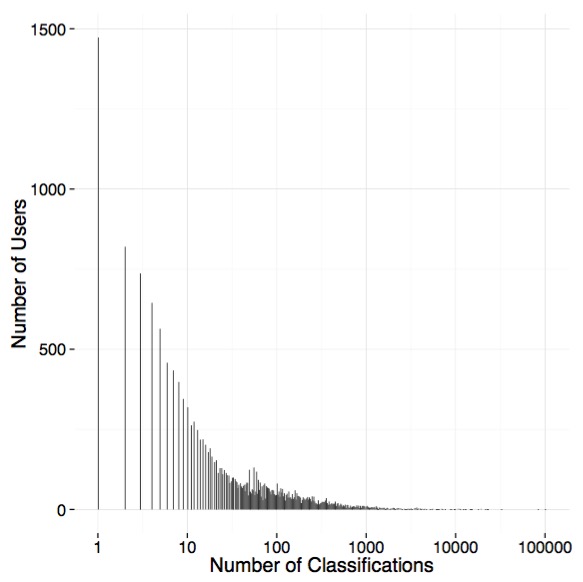
Many Zooniverse projects do well from a lot of people doing just a few images each. We’re no different. We have a nice distribution of folk with many doing few images (~1,500 have done just one classification), but with a looong tail with many users in the 100 to 1000 range. See below, but note the log10 scale on the x-axis.
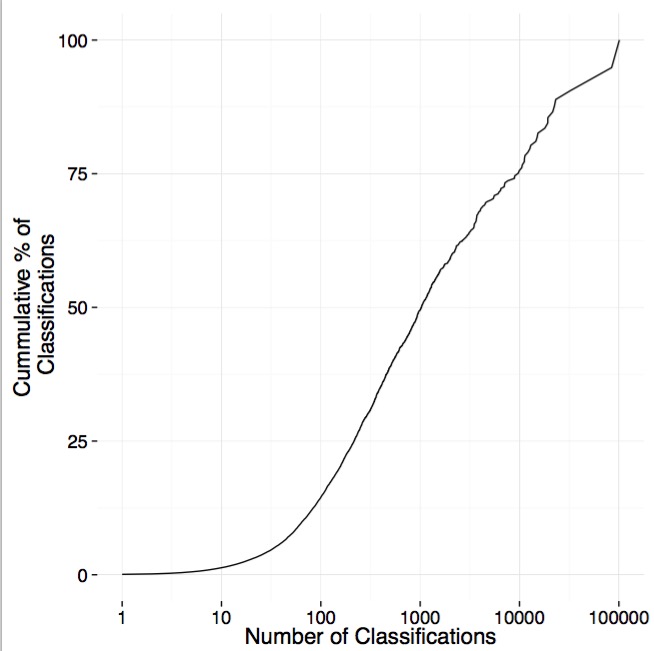
The average user, though, does ~125 classifications. If we put it together and look at the cumulative percentage of classifications done by users who classify different numbers of images, we see that ~25% is done by those users who classify less than ~250 images. So, our ‘super-users’ are incredibly important! Heck, we have one users who has contributed 5.15% of the classifications. The top 10 have contributed 18% of classifications.
It may still be difficult to see just how much those users are doing in comparison to users classifying only a few images. So, we’ve done what many other zooniverse projects have done, made a treemap!
It’s not only incredibly informative – with the size of each square being proportional to the contribution of an individual users – but, oh, pretty data! Enjoy!

Let There Be Coast!
Note: This post is from Briana Harder, our newest Science Team member! We encountered Briana in Talk where she not only noted some issues, but then wrote code to reprocess images to fix them! Needless to say, we were impressed. What emerged was a wonderful dialogue between Briana, members of the science team, and the folk at Zooniverse. She’s made some large changes to our image processing pipeline and helped us all learn a lot about how to use Landsat for kelp in places *other* than California. As such, we asked Briana if she wanted to take her involvement to the next level, and join the Science Team. And we were delighted when she accepted! So, here are her comments on the awesome work she did and how our image processing has changed.
The first thing to do upon finding an interesting problem is to find out if anyone else has solved it already. So I searched for research in the areas of image analysis and coastlines and satellite imagery. The majority of the papers were far too detail oriented to be very helpful, the problems in tracking the month to month changes of the coastline of a small island are wildly different from sorting coast from non-coast for FF! But I did find a fascinating paper on using Landsat data to build a highly accurate waterline database for all of Europe. They clearly solved the problem of finding ocean coastline, and then went a lot further!
The technique they used was to take a cloudless mosaic of the region–lots of preprocessing there!– and separate the image into three regions, water and land, selected with simple pixel value thresholds, and unassigned pixels. They then ran a region growing algorithm to add the unassigned pixels to either area.
This was good find for me, because they’re solving a very similar problem, and I know how to implement both those things! Unfortunately region growing is relatively slow and expensive, and it probably wouldn’t play nice with cloudy images. I did more digging over the next week, without finding anything else that was more promising. So I sat down, and wrote a little program.
Simplicity is important when you’re working with a lot of data; if the running time of the algorithm is longer than a person would take to do the same task, something has gone horribly wrong! I went through a couple iterations on how to find water, but in the end, this is what I ended up with.
Water is any pixel where the red value is between 1 and 25. Water’s very dark in all the bands, but it’s darkest in red, so that’s the best way to find it. If we’re clever about it, we only need to read the pixel values once, and perform some simple math operations, which means it should hardly take longer than opening up the image to view it.
– Count all the pixels that are water.
– Count all the pixels that are black, value 0. This ensures it’s not biased to throw out images that are on the edges of the Landsat scene.
– Calculate the percentage of non-black pixels that are water.
– If that percentage is above a certain threshold, we’re good to go, keep this image. I picked 5% as the threshold, based on a little trial and error.
And that’s it! It by no means gets rid of ALL the non-coast images, for example this does absolutely nothing for the abundance partially cloudy ocean images. It also gets tripped up by dark shadows on land, either from clouds or mountains, as shadows are just dark enough to fall within that threshold. Lakes are also selected, if they’re big enough.
The more complicated part comes after algorithms are made and tested: building them into the existing image processing pipeline. I wrote my algorithm in Python, making use of a few key libraries to do all the image processing; the pipeline is in Ruby, and uses a tool call ImageMagick for its image processing. I’m good at programming Python, I’d never touched Ruby until working on this project! And ImageMagick does seem quite ‘magical’ to someone who hasn’t used it before.
After reducing the problem of non-coast images, there’s the problem of the dark and red images that are especially common in the Tasmania dataset. The red part has been solved, but the darkness is still there for a lot of images. I have more work to do! But for now, we can say goodbye to a big chunk of the non-coast images in the next data set. No more bright blue snow-capped mountains, or solid fluffy cloud tops, or endless squares of farmland.
I’ll see you on Talk!
Tasmania Images Back!
You may have noticed that for the past few months Floating Forests has only been serving up California images. The Tasmania images that we were analyzing last year have been offline due to some image quality issues. However, thanks to a lot of hard work by the Zooniverse team and power user/image processing magician Briana Harder we are happy to announce that the Tasmania images are back! Not only are the image quality issues fixed, Briana has helped us implement an algorithm to filter out cloudy images and images that don’t contain any coastline (see upcoming post for more details). As a result, hopefully you will be spending less time skipping bad images and more time outlining those beautiful kelp forests!
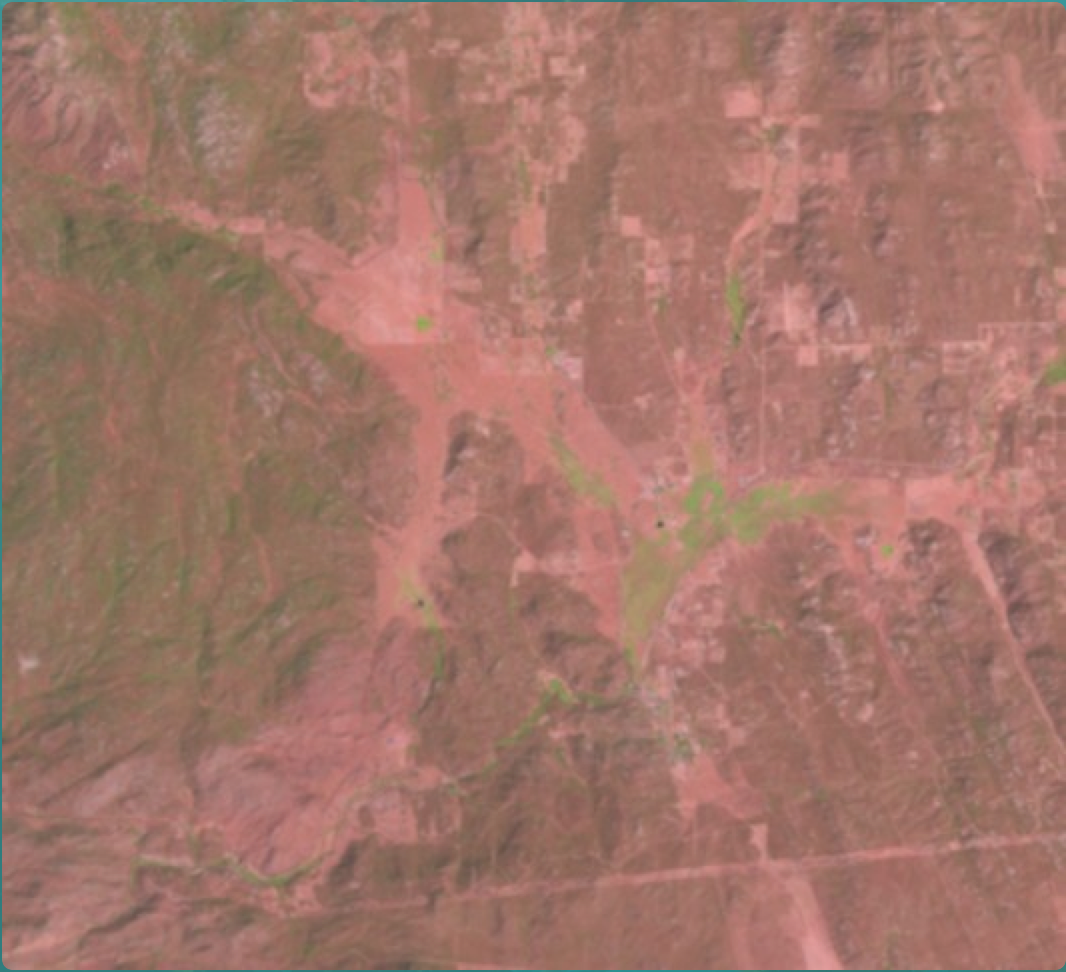
Less of this…
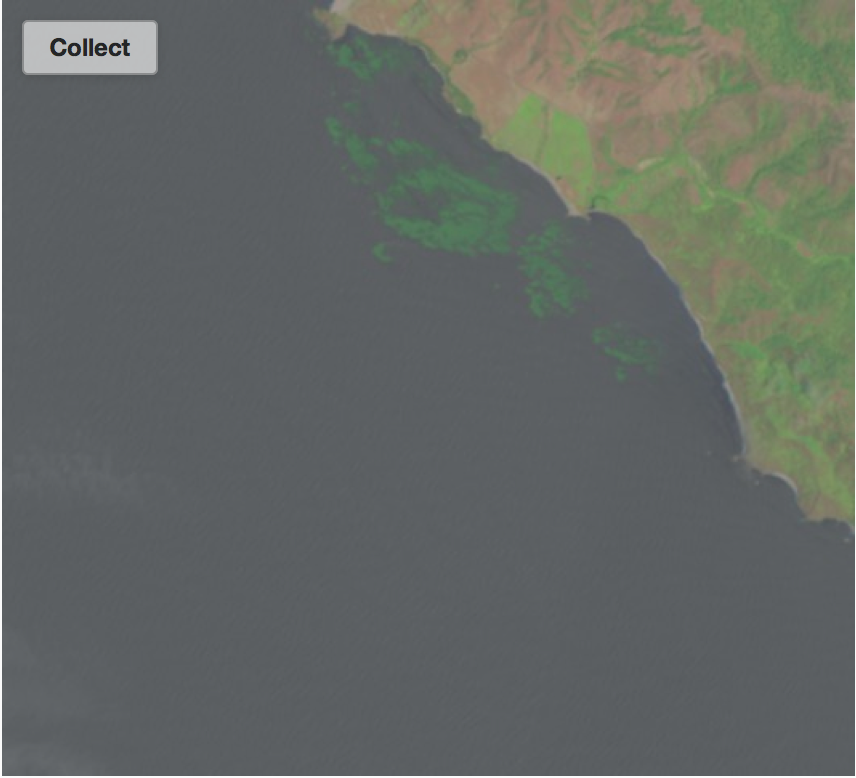
and more of this!
We have also improved the way in which we obtain images from USGS/NASA. This will make it easier for us to introduce data from other regions, so expect to see some images from Baja California, Chile, South Africa, and other temperate coastlines soon.
In the meantime, have fun with these Tasmania images. We’ve already started to document some major declines in kelp abundance in Tasmania over the past few decades thanks to your classifications. We are eager to obtain a better picture of these changes, but we need your help!
Floating Forests at Western Society of Naturalists 2014!
 Hi All,
Kyle, Alison, and I are just back from the annual meeting of the Western Society of Naturalists where we presented our progress with Floating Forests. The meeting took place in downtown Tacoma, Washington with over 500 marine ecologists, naturalists, and students in attendance.
We had some exciting discussions about the project at the poster session and the prospects of global coverage of kelp forest canopy dynamics has the potential to aid in the research of many scientists. Please click on the link below to download a high resolution copy of the poster.
Click Here for a Hi-Res Floating Forests Poster!
Great job everyone!
Where are we getting these images?
All of the images we are currently using in Floating Forests come from the Landsat satellite program. The Landsat program is an incredible series of satellites managed jointly by NASA and USGS that has been collecting imagery of the earth almost continuously since the early 1970s! This first Landsat satellite was launched in 1972 and the most recent, Landsat 8, was launched in February 2013. For Floating Forests we are using data from Landsat 4, 5, 7 and 8. We aren’t using data from earlier Landsat missions because the coarser resolution of these earlier satellites makes identifying kelp even more difficult than it already is. We also are not using data from Landsat 6 because this sensor crashed into the Indian Ocean soon after it was launched.

Timeline of the Landsat program
My favorite Landsat sensor has to be Landsat 5. This satellite was launched in 1984 and had an expected life span of 3 years. But it kept chugging along for an incredible 29 years and was only recently decommissioned in June 2013, giving it the Guinness World Record for the “longest operating earth observation satellite”. The long-term nature of the Landsat program is what makes it special. This data allows us to peek back in time to see how the earth has responded to climate change, human land-use change, disturbances like forest fires, mudslides, earthquakes, volcanic activity, and many other processes. Landsat has been used to monitor crop and forest harvests, map geologic features, monitor coral reef health, explore for oil and gas, measure changes in glacial coverage, track oil spills, aid regional planning, and for many, many other applications including, of course, tracking changes in giant kelp forests!
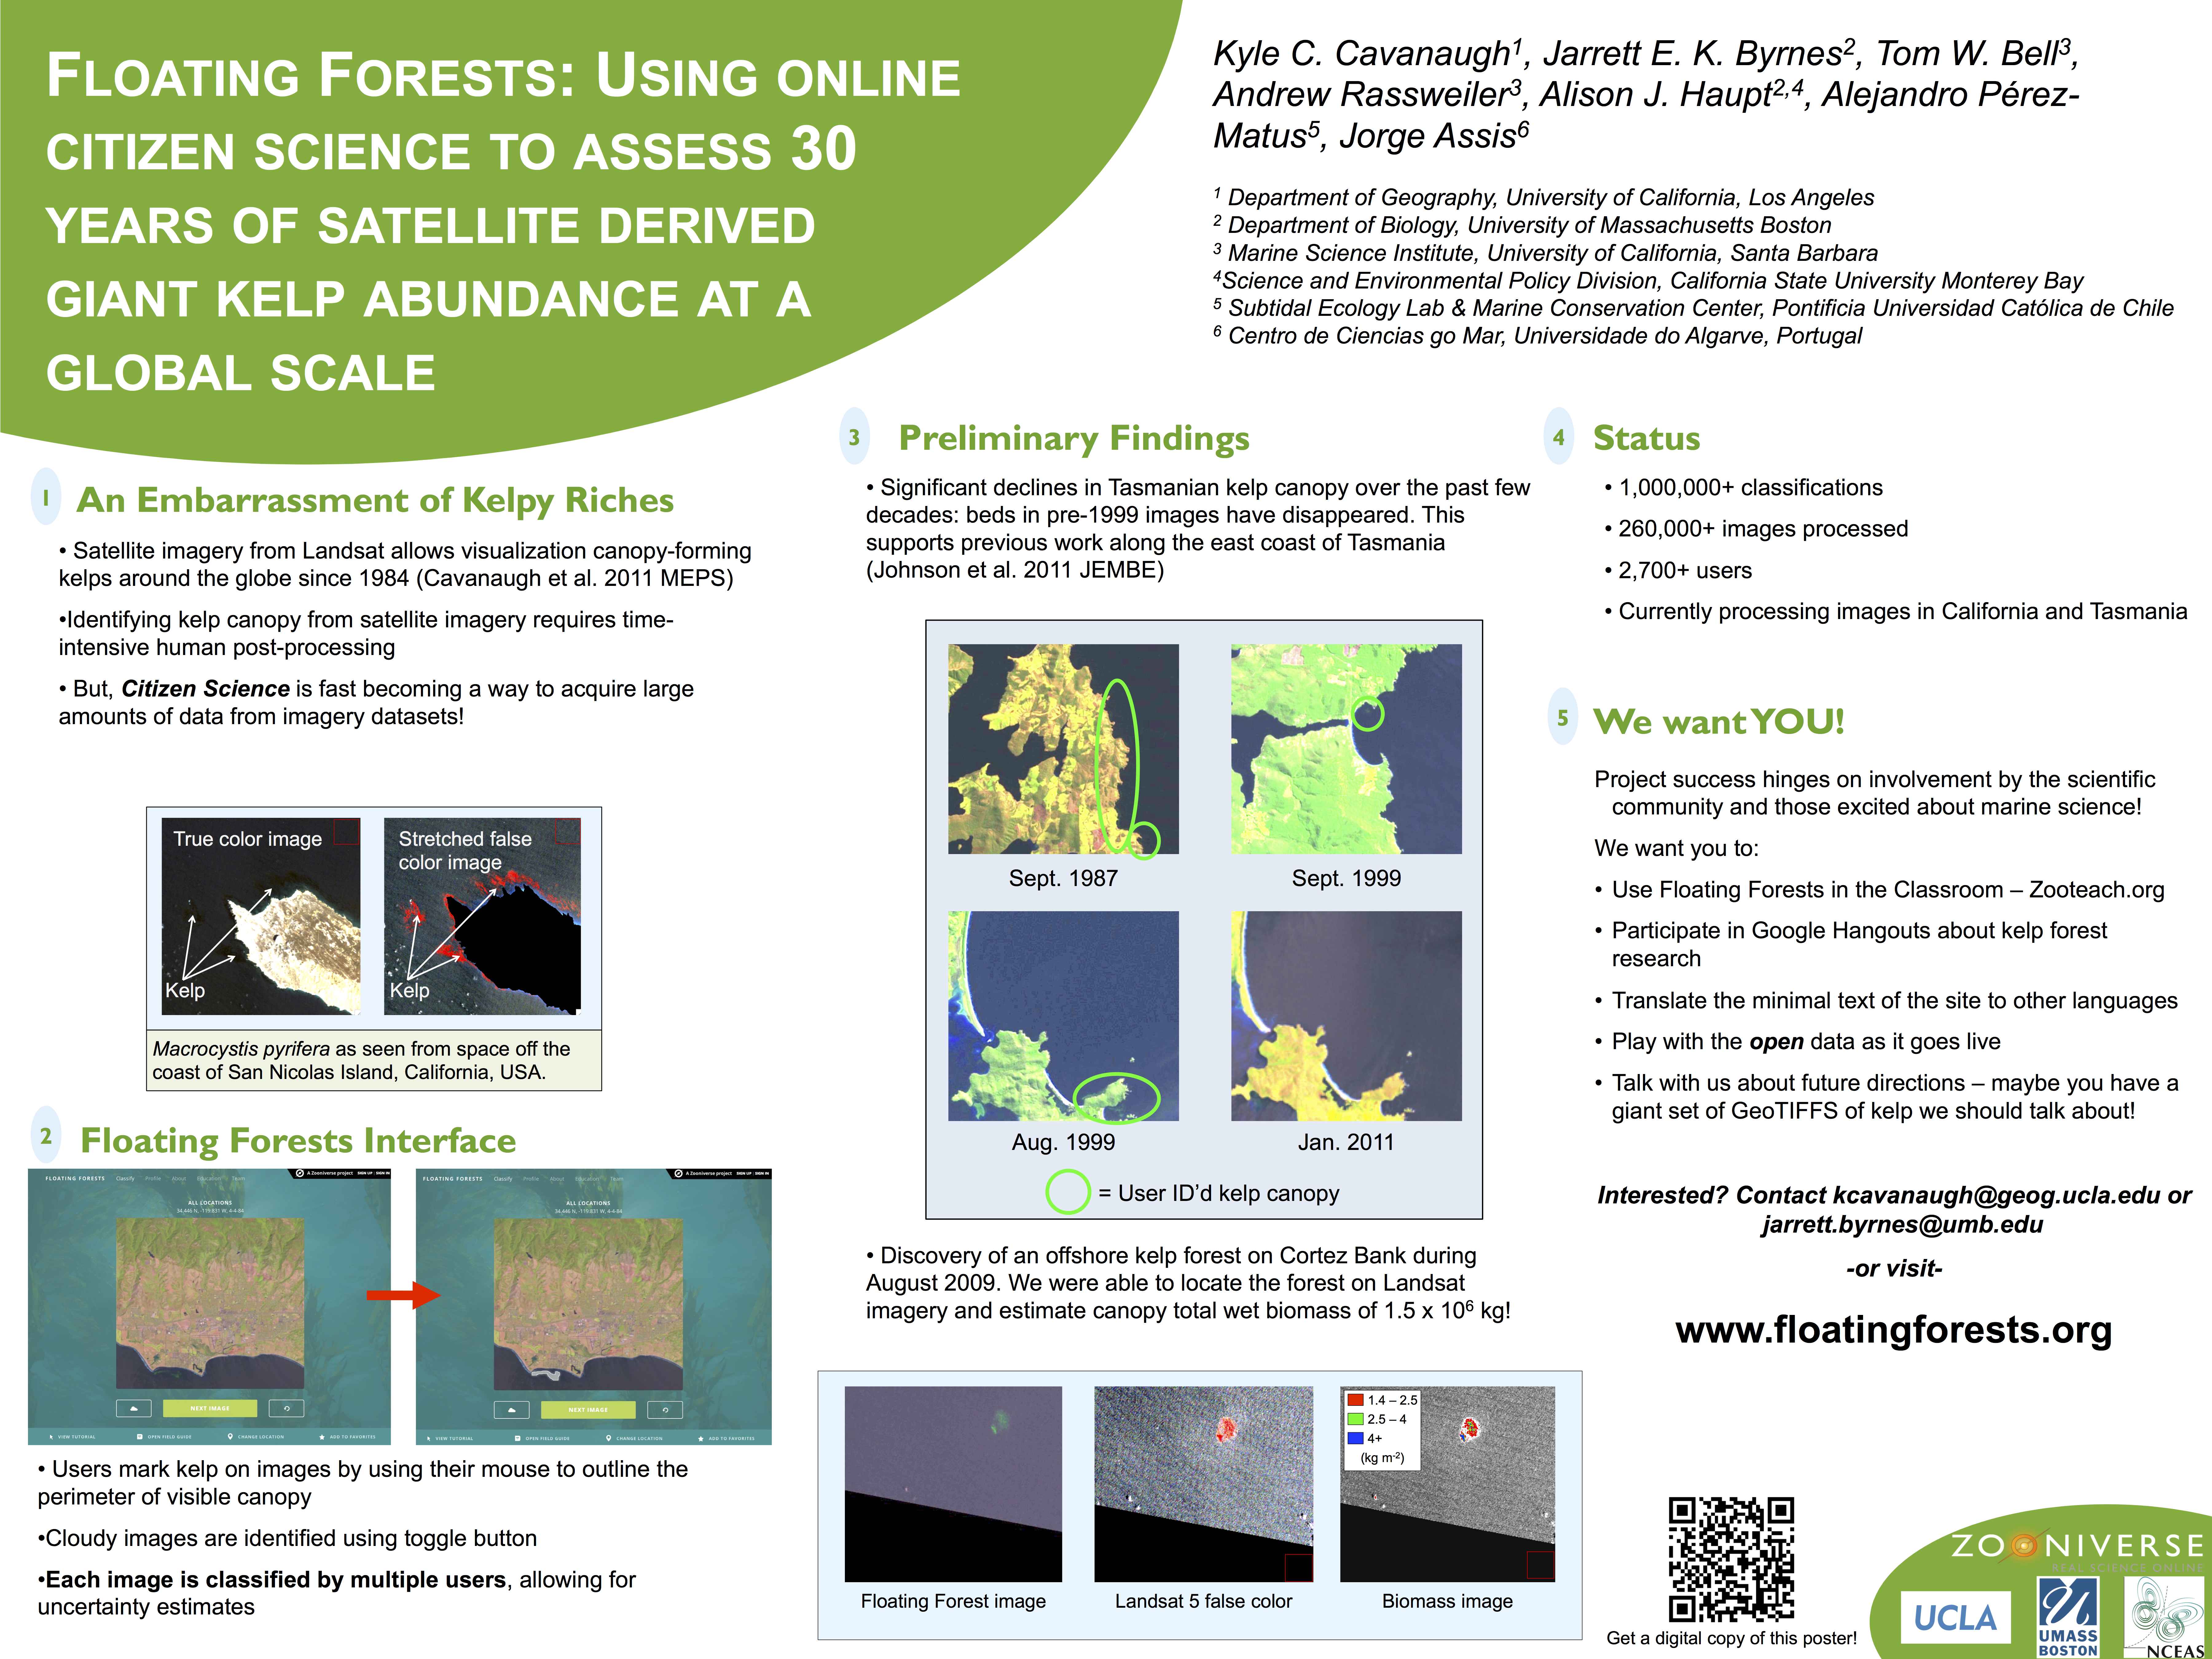
Landsat false-color infrared image of Long Island, Bahamas. Image from NASA.
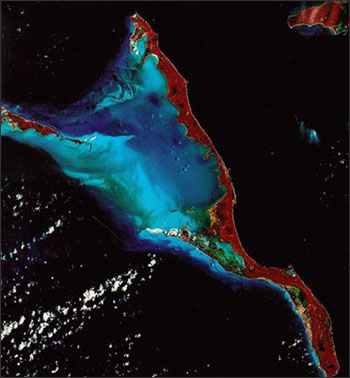
These images from July 22 and October 2, 1988 document the dramatic forest fires that occurred in and adjacent to Yellowstone National Park. Image from NASA
Best of all, since 2008 Landsat imagery has been available to the public at no cost. This has dramatically increased the ability of scientists to conduct the kind of long-term study that we are doing here at Floating Forests. It also has unleashed a flood of data: millions of scenes have already been collected and hundreds of new scenes are acquired each day by the Landsat satellites currently in orbit (Landsat 7 & 8). The challenge now is in developing ways to make sense of all of this data. Citizen science projects like Floating Forests are one exciting approach for tackling this problem, new automated processing algorithms are another.
Are you interested in performing your own analysis on Landsat imagery? Or would you like to make some art from these beautiful images? If so, it’s easy to download the data. Simply go to GLOVIS or EarthExplorer to get started. You can also watch a live feed of Landsat acquisition here.
Keybindings!
Looking for a quicker way to move through the non-kelp images? You can now type ‘n’ on your keyboard instead of clicking the “NEXT IMAGE” button. You can also use ‘c’ to toggle the cloud button. Happy hunting!

Recent Comments